
Table of contents
1. Overview
2. Option summary
3. Example usage
6. Intersection function: Depth vs Nr of features (--fun option)
2. Option summary
3. Example usage
3.1.
Default behaviour (--fun=depth --to=overlap)
3.2. Using --fun "nover" and "depth" (--fun=nover --to=overlap --ty=bed)
3.3. Difference between overlap and sliding (--to=sliding)
3.4. Using sliding windows (--btype and -b)
3.5. Enforcing strand (-s)
4. Input file formats (--tx/--typeX and --ty/--typeY options)3.2. Using --fun "nover" and "depth" (--fun=nover --to=overlap --ty=bed)
3.3. Difference between overlap and sliding (--to=sliding)
3.4. Using sliding windows (--btype and -b)
3.5. Enforcing strand (-s)
4.1. Bedgraph
4.2. Bed
4.3. Important requirements of input files (sorting, headers, positive/negative values, etc)
5. Intersecting genomic
features: calculation of sliding profiles4.2. Bed
4.3. Important requirements of input files (sorting, headers, positive/negative values, etc)
5.1.
Overlap vs Sliding method (--to/--typeO
option)
5.2. Defining sliding windows
5.3. Important concepts regarding the -b/--bins and -bt/--btype options for the calculation of sliding profiles
5.2. Defining sliding windows
5.3. Important concepts regarding the -b/--bins and -bt/--btype options for the calculation of sliding profiles
6. Intersection function: Depth vs Nr of features (--fun option)
1. Overview
OGRe stands for Overlap Genomic Regions. OGRe is a stand-alone script that was developed to be used within SeqGI.
Fjoin algorithm
The basis of OGRe algorithm is an adaptation of the original algorithm "Fjoin" (Richardson, 2006).
The Fjoin algorithm makes use of sorted lists of the starts and ends of all the intervals and scans every interval from left to right, more or less in parallel, outputting when an overlap is found. The Fjoin algorithm allows for the rapid search of overlapping features in a remarkably simple procedure.
2. Option summary
Usage: $ python OGRe_V0.2.py -x fileX -y fileY -o outputname [OPTIONS]
3.2.
Using --fun=nover
and --fun=depth (--to=overlap --ty=bed)
--to=sliding
The "sliding" method, allows the user to explore the pattern of the ChIP signal at the genomic intervals in feature-set X. The distribution profile is calculated by using a sliding window that scans each genomic interval defined in X. when --to=sliding / --typeO=sliding the intersection function is always --fun=depth. The output is given in terms of the average depth signal in each sliding window.
For example (--to=sliding -b 20 --btype=perc):
In the example above we have defined the sliding window as percentage (-b 20 --btype=perc). The sliding window was chosen to be 20% of the total length of each feature X.
4. Input file formats
>> Files have to be sorted by start position
To prevent mistakes in the calculation of the overlaps, SeqGI checks if the genomic intervals are in ascending order as it is running.
>> X,Y features must contain start > end and only positive positions
>> BedGraph features should contain only numeric values in the forth column
>> Headers and commented lines (#) are allowed
>> Input and output data are zero-based
5. Intersecting genomic features: calculation of sliding profiles
Overlapping
features can be calculated using either
the "Overlaps"
or "Sliding" methods:
For example:
________________________________________________________________________________________________
File X: ==================== ========= ===============
File Y: ====== ==== ===== ====
Result: ==================== ========= ===============
score ~ 2 overlapping Y features score ~ 1 overlapping Y feature score = 0
__________________________________________________________________________________________________
Consider the
following example:
OGRe stands for Overlap Genomic Regions. OGRe is a stand-alone script that was developed to be used within SeqGI.
- OGRe allows you to intersect two sets of genomic features (X,Y) and find overlaps between them.
- The overlaps are recorded for all features in set X, independently of an overlap being found or not.
The basis of OGRe algorithm is an adaptation of the original algorithm "Fjoin" (Richardson, 2006).
The Fjoin algorithm makes use of sorted lists of the starts and ends of all the intervals and scans every interval from left to right, more or less in parallel, outputting when an overlap is found. The Fjoin algorithm allows for the rapid search of overlapping features in a remarkably simple procedure.
2. Option summary
Usage: $ python OGRe_V0.2.py -x fileX -y fileY -o outputname [OPTIONS]
| Options | Description |
| -h, --help | shows the full menu of available options |
| -x <file>, --fileX=<file> | Complete path to file X. The overlaps are recorded for all features in set X, independently of an overlap being found or not. Typically file X is a gene list (BED) |
| -y <file>, --fileY=<file> | Complete path to file Y. Typically set Y is a list of reads (BED, BedGraph) |
| -o <file>, --out=<file> | Complete path to output filename |
| -f <string>, --fun=<string> | [optional] Intersection function could be nr of overlapping features, or depth of coverage ("nover" or "depth", respectively). By default --fun=depth |
| --tx=<string>, --typeX=<string> | [optional] Type fileX (bedgraph, bed, bed12). Default is --tx=bed |
| --ty=<string>, --typeY=<string> | [optional] Type fileY (bedgraph, bed, bed12). Default is --ty=bedgraph |
| --to=<string>, --typeO=<string> | [optional] Type of output (overlap or sliding). Default is --to=overlap |
| --sx, --sortX | [optional] Specify if need to sort fileX |
| --sy, --sortY | [optional] Specify if need to sort fileY |
| -s, --enforcestrand | [optional] Only report overlaps on the
same strand. By default, strand info is ignored. Only "+" and "-"
strands
are valid, any other symbol in X or Y will be skipped. |
| -b <string>, --bins=<string> | Sliding window size. Only needed if --to=sliding. Needs to be specified together with "--btype". For example --bins=10 and --btype=nuc corresponds to a sliding window of 10 nucleotides. Default is None. |
| --bt=<string>, --btype=<string> | Type of bins. Only needed if --to=sliding. Needs to be specified together with "--bins". For example --bins=10 and --btype=perc corresponds to a sliding window of 10% of the total size of the genomic feature. Default is None. |
3.1. Default behaviour (--fun=depth --to=overlap)
By default, OGRe assumes that the input
file X is a BED file and file Y
a BedGraph file. Other options assumed by default are the intersection
function (--fun=depth) and type of output (--to=overlap).
For example (--to=overlap):
For example (--to=overlap):
| $ cat X.bed chr1 100 200 geneA chr1 1000 2000 geneB $ cat Y.bedgraph chr1 150 250 3 $ python OGRe_V0.2.py -x X.bed -y Y.bedgraph -o results.txt $cat results.txt #Created by Python OGRe (SeqGI format) #fileX: X.bed #fileY: Y.bedgraph #typeX: bed, typeY: bedgraph #intersection function: depth, enforcestrand: False #ID Chr Start End Strand WindowLength Counts AvCounts geneA chr1 100 200 None 100 150 1.5 geneB chr1 1000 2000 None 1000 0 0.0 |
3.2.
Using --fun=nover
and --fun=depth (--to=overlap --ty=bed)
Each nucleotide from the read that is
overlapped contributes to one
count. This type of score is also known as the "depth of coverage" or
"breadth of the overlap".
--fun=nover
the overlap is quantified considering considering uniquely the start position of each feature Y that overlaps with each feature X.
--fun=depth
In the following example, we should see the same result as in the previous example. The only difference is that file Y is in the "BED" format now:
| $ cat X.bed chr1 100 200 geneA chr1 1000 2000 geneB $ cat Y.bed chr1 150 250 chr1 150 250 chr1 150 250 $ python OGRe_V0.2.py -x X.bed -y Y.bedgraph -o results.txt --ty=bed --fun=depth $cat results.txt #Created by Python OGRe (SeqGI format) #fileX: X.bed #fileY: Y.bedgraph #typeX: bed, typeY: bedgraph #intersection function: depth, enforcestrand: False #ID Chr Start End Strand WindowLength Counts AvCounts geneA chr1 100 200 None 100 150 1.5 geneB chr1 1000 2000 None 1000 0 0.0 |
In the example above we have used
--fun=depth to compute the depth of coverage, or the breadth of the
overlap, for each gene. The option --fun=nover gives the number of
reads overlapping each gene.
--fun=nover
| $ cat X.bed chr1 100 200 geneA chr1 1000 2000 geneB $ cat Y.bed chr1 150 250 chr1 150 250 chr1 150 250 $ python OGRe_V0.2.py -x X.bed -y Y.bedgraph -o results.txt --ty=bed --fun=nover $cat results.txt #Created by Python OGRe (SeqGI format) #fileX: X.bed #fileY: Y.bedgraph #typeX: bed, typeY: bedgraph #intersection function: depth, enforcestrand: False #ID Chr Start End Strand WindowLength Counts AvCounts geneA chr1 100 200 None 100 3 0.03 geneB chr1 1000 2000 None 1000 0 0. |
3.3. Difference between overlap (--to=overlap) and sliding (--to=sliding)
The overlap between feature X and Y is calculated using the total length of a genomic interval in X.--to=sliding
The "sliding" method, allows the user to explore the pattern of the ChIP signal at the genomic intervals in feature-set X. The distribution profile is calculated by using a sliding window that scans each genomic interval defined in X. when --to=sliding / --typeO=sliding the intersection function is always --fun=depth. The output is given in terms of the average depth signal in each sliding window.
For example (--to=sliding -b 20 --btype=perc):
| $ cat X.bed chr1 100 200 geneA chr1 1000 2000 geneB $ cat Y.bedgraph chr1 150 250 3 $ python OGRe_V0.2.py -x X.bed -y Y.bedgraph -o results.txt --to=sliding -b 20 --btype=perc $cat results.txt #Created by Python OGRe (SeqGI format) #fileX: X.bed #fileY: Y.bedgraph #typeX: bed, typeY: bedgraph #intersection function: depth, enforcestrand: False #Reporting binned windows of 20.0% each geneA chr1 100 200 None 0.0 0.0 1.5 3.0 3.0 geneB chr1 1000 2000 None 0.0 0.0 0.0 0.0 0 |
In the example above we have defined the sliding window as percentage (-b 20 --btype=perc). The sliding window was chosen to be 20% of the total length of each feature X.
For example (--to=sliding -b 25
--btype=nuc)
| $ cat X.bed chr1 100 200 geneA $ cat Y.bedgraph chr1 150 250 3 $ python OGRe_V0.2.py -x X.bed -y Y.bedgraph -o results.txt --to=sliding -b 25 --btype=nuc $cat results.txt #Created by Python OGRe (SeqGI format) #fileX: X.bed #fileY: Y.bedgraph #typeX: bed, typeY: bedgraph #intersection function: depth, enforcestrand: False #Reporting binned windows of 25.0nuc each geneA chr1 100 200 None 0.0 0.0 3.0 3.0 |
In the example above we have used a
sliding
window of 25 nucleotides (-b 25
--btype=nuc). Since the first feature X (chr1,100,200) is 100nuc
long we get 4 sliding windows in the output.
3.5. Enforcing strand (-s)
By default, OGRe will report any
overlaps independently of the features
X,Y being on the same or opposite strands. To only allow overlaps on
the same strand the "-s" option is used.
Since the BedGraph format does not carry
strand information, this
option is not valid when using Bedgraph files. Only "+" and "-" strands
are valid, any other symbol in X or Y will be skipped (i.e. they are
not considered in any calculation).
For example (note that geneB in the
negative strand does not
overlap with any Y feature in the positive):
| $ cat X.bed chr1 100 200 geneA 0 + chr1 100 200 geneB 0 - $ cat Y.bedgraph chr1 150 250 0 0 + chr1 150 250 0 0 + chr1 150 250 0 0 + $ python OGRe_V0.2.py -x X.bed -y Y.bed -o results.txt --to=overlap --tx=bed --ty=bed --fun=nover -s $cat results.txt #Created by Python OGRe (SeqGI format) #fileX: X.bed #fileY: Y.bed #typeX: bed, typeY: bed #intersection function: nover, enforcestrand: True #ID Chr Start End Strand WindowLength Counts AvCounts geneA chr1 100 200 + 100 3 0.03 geneB chr1 100 200 - 100 0 0.0 |
4. Input file formats
4.1. BedGraph
BedGraph is tabular format developed for use with the UCSC genome browser (see http://genome.ucsc.edu/FAQ/FAQformat#format1.8). Chromosome, start, end coordinates and a coverage value are specified in the following format:chromosome start end coveragevalue1For ChIP-Seq and RNA-Seq datasets, the coverage value corresponds to the depth of coverage in the correspondent genomic position.
chromosome start end coveragevalue2
4.2. BED
BED is tabular format also developed for use with the UCSC genome browser (see http://genome.ucsc.edu/FAQ/FAQformat#format1). The first three fields are mandatory and consist of chromosome, start, end. If "BED" is specified as the file format type, SeqGI will make use of the first three fields. strand (position 6) and ID (position 4) will only be used if available. All the other fields will be ignored by SeqGI.BED3 format: chromosome start end
BED4 format: chromosome start end ID
BED5 format: chromosome start end ID score
BED6 format: chromosome start end ID score strand
4.3. Important requirements of input files (sorting, headers, positive/negative values, etc)
>> Files have to be sorted by start position
It is mandatory that the genomic coordinates within the input files are
sorted by start position to run OGRe script. If the files are not
sorted specify --sortx and --sorty.The internal sorting is memory
intensive as it depends on the loading of the complete file into the
memory. One way to go around this issue is to use previously sorted
files (using command line tools such as the ?sort? command in Unix).
E.g. (sorting by start position in UNIX)
E.g. (sorting by start position in UNIX)
| sort -k2n X.bed -o X.bed sort -k2n Y.bed -o Y.bed |
To prevent mistakes in the calculation of the overlaps, SeqGI checks if the genomic intervals are in ascending order as it is running.
>> X,Y features must contain start > end and only positive positions
OGRe will stop if any feature X or Y
has negative start or end
positions, or if the start position is greater then the end position.
>> BedGraph features should contain only numeric values in the forth column
BedGraph file contains count-type data
for each feature which
is encoded on 4th column (see http://genome.ucsc.edu/FAQ/FAQformat#format1.8
for details). OGRe will stop if non-numeric data is found in the 4th
column.
>> Headers and commented lines (#) are allowed
OGRe will skip any line that starts
with "track", "browser" or the
comment character "#".
>> Input and output data are zero-based
OGRe, just like BEDtools and SAMtools (but unlike Genomic Ranges /
IRanges), assumes that the coordinates in each genomic feature have
zero-based (0-based) start positions. Although this representation can
be a little bit less intuitive, it facilitates coordinate arithmetic
(see http://genome.ucsc.edu/FAQ/FAQtracks#tracks1 for more details).
Similarly, any output returned by OGRe will be 0-based.
>> If "-s" is chosen, only "+" and "-" strands are valid, any other symbol in X or Y will be skipped
When using "enforce strand" (option
-s), OGRe will report
overlaps only if they are on the same strand. In this case, only "+"
and "-" strands are valid. OGRe will skip features which contain other
symbols (i.e. the corresponding coordinates will not be considered in
any calculation).
5. Intersecting genomic features: calculation of sliding profiles
5.1. Overlap vs. Sliding method
The initial step in a workflow within SeqGI is the computation of overlaps between two feature sets (X,Y). The computation of overlaps is mandatory to continue analysis under SeqGI. Typically, SeqGI would be used to calculate how many reads from a given ChIP/RNA sample overlap with each gene in the genome.- The overlaps are recorded for all features in set X, independently of an overlap being found or not.
- Two features (X,Y) are "overlapping" if they have ate least one base pair in common
For example:
________________________________________________________________________________________________
File X: ==================== ========= ===============
File Y: ====== ==== ===== ====
Result: ==================== ========= ===============
score ~ 2 overlapping Y features score ~ 1 overlapping Y feature score = 0
__________________________________________________________________________________________________
Overlap
format
In
the “Overlap” type of
output, the overlap
between
feature X and Y is calculated using the total length of a genomic
interval in X.
The format of “Overlap” files contain 8 tab delimited columns:
The format of “Overlap” files contain 8 tab delimited columns:
- ID, chromosome, start, end, strand derived from file 1 (feature set X)
- Window length: size of the window (end – start)
- Counts: calculated as either the number of overlaps ("nover") or depth of coverage ("depth").
- Average counts: counts normalised to the window length
Sliding
format
The
“Sliding” format,
allows the user to explore
the
pattern of the ChIP signal at the genomic intervals of feature-set X.
The distribution profile is calculated by using a sliding window that
scans each genomic interval defined in feature-set X.
If
the genomic
intervals in feature-set X contain strand information, then the
sliding windows are defined for all genomic intervals in the same
orientation (5' to 3'), otherwise left to right would be used. See the
next section 5.2.
Calculation of sliding profiles for more details.
The format of “Sliding” files consist of:
The format of “Sliding” files consist of:
- Five initial feature descriptors (as in *.Overlap): ID, chromosome, start, end, strand derived from file 1 (feature set X)
- Columns after the 7th column correspond to counts normalised to the binned window length.
File sorting:
- It is mandatory that the genomic coordinates within the input files are sorted by start position to run OGRe script. If the files are not sorted an option to “sort file X/Y” needs to be selected to sort the files internally before scanning the files for overlaps. The internal sorting is memory intensive as it depends on the loading of the complete file into the memory. One way to go around this issue is to use previously sorted files (using command line tools such as the “sort” command in Unix). To prevent mistakes in the calculation of the overlaps, SeqGI checks if the genomic intervals are in ascending order as it is running.
5.2. Calculation of sliding profiles
When building sliding files, SeqGI computes a binned complete coverage vector of each feature X. The binned coverage vector is calculated using a moving sliding window which computes the average depth of coverage at each bin.- The length of the sliding window can be either a fixed size (in bps) or a percentage of the total size of feature X.
- Defining the sliding window as a percentage is particularly important when the genomic intervals are not all of the same size, thus the percentage is used to scale each interval to a common length.
Consider the
following example:
| $ cat X.bed chr1 100 200 chr1 1000 2000 $ cat Y.bedgraph chr1 150 250 3 $ python OGRe.py -x X.bed -y Y.bedgraph -o results.txt --to=sliding -b 20 --btype=perc $cat results.txt #Created by Python OGRe (SeqGI format) #fileX: X.bed #fileY: Y.bedgraph #typeX: bed, typeY: bedgraph #intersection function: depth, enforcestrand: False #Reporting binned windows of 20.0% each None chr1 100 200 None 0.0 0.0 1.5 3.0 3.0 None chr1 1000 2000 None 0.0 0.0 0.0 0.0 0.0 |
In the
example above we defined the sliding window as
percentage (-b 20 --btype=perc). The sliding window was chosen to be
20% of the total length of each feature X.
The first feature X (chr1,100,200) is 100bp long, thus each sliding window has 20 nuc.
In the "result.txt" files, OGRe reports the depth of coverage in each sliding window normalised to the sliding window length:
Complete coverage vector:
0 0 0 0 0 0 0 0 0 0 0 0 0 0 0 0 0 0 0 0 0 0 0 0 0 0 0 0 0 0 0 0 0 0 0 0 0 0 0 0 0 0 0 0 0 0 0 0 0 0 3 3 3 3 3 3 3 3 3 3 3 3 3 3 3 3 3 3 3 3 3 3 3 3 3 3 3 3 3 3 3 3 3 3 3 3 3 3 3 3 3 3 3 3 3 3 3 3 3 3
Sliding file:
window1 window2 window3 window4 window5
window coordinates: (100-120) (120-140) (140-160) (160-180) (180-200)
Window length: 20 20 20 20 20
Raw counts: 0 0 30 60 60
Average Counts: 0 0 1.5 3.0 3.0
5.3. Important
concepts regarding the -b/--bins and -bt/--btype options for the
calculation of sliding profiles
6. Intersection function: Depth vs Nr of features
The first feature X (chr1,100,200) is 100bp long, thus each sliding window has 20 nuc.
In the "result.txt" files, OGRe reports the depth of coverage in each sliding window normalised to the sliding window length:
Complete coverage vector:
0 0 0 0 0 0 0 0 0 0 0 0 0 0 0 0 0 0 0 0 0 0 0 0 0 0 0 0 0 0 0 0 0 0 0 0 0 0 0 0 0 0 0 0 0 0 0 0 0 0 3 3 3 3 3 3 3 3 3 3 3 3 3 3 3 3 3 3 3 3 3 3 3 3 3 3 3 3 3 3 3 3 3 3 3 3 3 3 3 3 3 3 3 3 3 3 3 3 3 3
Sliding file:
window1 window2 window3 window4 window5
window coordinates: (100-120) (120-140) (140-160) (160-180) (180-200)
Window length: 20 20 20 20 20
Raw counts: 0 0 30 60 60
Average Counts: 0 0 1.5 3.0 3.0
5.3. Important
concepts regarding the -b/--bins and -bt/--btype options for the
calculation of sliding profiles
>> Coverage vector is reversed for negative stranded (X) features
If the genomic intervals in
feature-set X contain strand
information, then the sliding windows are defined for all genomic
intervals in the same orientation (5' to 3'), otherwise left to right
would be used. In other words, if a feature X is in the reverse
orientation (strand == "-") the coverage vector is reversed.
>> If the bin size (-b) is specified in nucleotides (--btype=nuc), all features X have to be of the same length.
When the "sliding" mode is chosen, OGRe
will firstly calculate the coverage
vector for each feature X
at the nucleotide resolution. The complete coverage vector is then subset into
bins of a user-defined length (option -b) to originate an aggregate vector. Each feature X is
then characterized by an aggregate
vector.
To continue the analysis within SeqGI it is required that the length of the resulting aggregate vector is the same between all features X.
When the bin size (-b) is given in nucleotides (--btype=nuc), OGRe will use this value to represent the size of each bin. Therefore all features in X have to have the same length, otherwise the resulting aggregate vector would have different lengths for different windows.
>> If --btype=perc, the bin size has to be a multiple 100
When the bin size (-b) is given in
percentage (--btype=perc), OGRe will
use this percentage value to calculate the size of the sliding windows
for each feature X. In this case, the number of sliding windows used to
summarize each feature X is the same for all features, but the
size of the sliding windows is calculated as a function of the
percentage of the total size of each feature. Therefore, different
features X can have different sizes. For example `-b 1
--btype=perc` will correspond to 100 windows of 1% each; `-b 5
--btype=perc` will correspond to 20 windows of 5% each. However, in
this sense, it is required that the bin size is a multiple of 100. For
example -b 3 --btype=perc is not allowed.
>> If --btype=perc OGRe will skip features X if the entire length of the feature (start to end) is less then the number of sliding windows
When the bin size (-b) is given in
percentage (--btype=perc), OGRe will
use this percentage value to calculate the size of the sliding windows
(i.e. the bin size) for each feature X. However, since the bin size
corresponds to a "number of nucleotides" it cannot be smaller then 1.
For example, if `-b 1 --btype=perc` is chosen, each feature X is
characterized by 100 bins (100 bins of 1% each) . The length of each
bin corresponds to 1% of the total length of the feature X. Therefore
in this case, OGRe would skip any feature X which is smaller then
100 bps. Similarly, if -b 5 --btype=perc` is chosen (20 windows
of
5% each) OGRe would skip features X shorter then 20 nucleotides.
6. Intersection function: Depth vs Nr of features
The
user
can quantify
the overlap between two genomic intervals (X,Y)
using between two options:
- --fun=nover: In this case the overlap is quantified considering considering uniquely the start position of each feature Y that overlaps with each feature X.
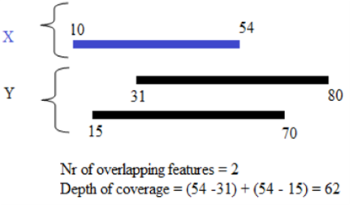
- --fun=depth: In this case each nucleotide from the read that is overlapped contributes to one count. This type of score is also known as the "depth of coverage" or "breadth of the overlap".
If
sequencing reads are
imputed in the BedGraph format, the
only intersection function available is the “depth of
coverage” (--fun=depth). This is because the BedGraph format does not
have
single-read information, but stores count-type data.